![]()
Free Salesforce Analytics-Con-301 Study Guides Exam Questions and Answer
Analytics-Con-301 Exam Dumps, Analytics-Con-301 Practice Test Questions
Salesforce Analytics-Con-301 Exam Syllabus Topics:
| Topic | Details |
|---|---|
| Topic 1 |
|
| Topic 2 |
|
| Topic 3 |
|
NEW QUESTION # 28
A client is using Tableau to visualize data by leveraging security token-based credentials. Suddenly, sales representatives in the field are reporting that they cannot access the necessary workbooks. The client cannot recreate the error from their offices, but they have seen screenshots from the field agents. The client wants to restore functionality for the field agents with minimal disruption.
Which step should the consultant recommend to accomplish the client's goal?
- A. Change the data source permissions for the connection to "Prompt User."
- B. Renew the security token via the Data Connection on Tableau Server.
- C. Ask the workbook owners to republish the workbooks to refresh the security token.
- D. Ensure that "Allow Refresh Access" was checked when the data source was published.
Answer: B
Explanation:
When field agents are unable to access workbooks due to issues with security token-based credentials, the most immediate and least disruptive solution is to renew the security token. This can be done through the Data Connection settings on Tableau Server. Renewing the token will restore access for the field agents without requiring them to take any action or affecting other users.
References: The use of personal access tokens (PATs) in Tableau and the procedure for renewing them are documented in Tableau's official resources. It is noted that PATs are long-lived authentication tokens that can be revoked and renewed to manage access securely1. Additionally, there have been discussions in the Tableau Community regarding issues with concurrent PAT access, which further supports the need to manage tokens effectively2.
NEW QUESTION # 29
A Tableau Cloud client has requested a custom dashboard to help track which data sources are used most frequently in dashboards across their site.
Which two actions should the client use to access the necessary metadata? Choose two.
- A. Connect directly to the Site Content data source within the Admin Insights project.
- B. Access metadata through the Metadata API.
- C. Download metadata through Tableau Catalog.
- D. Query metadata through the GraphiQL engine.
Answer: B,D
Explanation:
To track which data sources are used most frequently across a site in Tableau Cloud, the client should use the GraphiQL engine and the Metadata API. The GraphiQL engine allows for interactive exploration of the metadata, making it easier to construct and test queries1. The Metadata API provides access to metadata and lineage of external assets used by the content published to Tableau Cloud, which is essential for tracking data source usage2.
References: The actions are based on the capabilities of the GraphiQL engine and the Metadata API as described in Tableau's official documentation and learning resources321.
NEW QUESTION # 30
A client wants to see the average number of orders per customer per month, broken down by region. The client has created the following calculated field:
Orders per Customer: {FIXED [Customer ID]: COUNTD([Order ID])}
The client then creates a line chart that plots AVG(Orders per Customer) over MONTH(Order Date) by Region. The numbers shown by this chart are far higher than the customer expects.
The client asks a consultant to rewrite the calculation so the result meets their expectation.
Which calculation should the consultant use?
- A. {EXCLUDE [Customer ID]: COUNTD([Order ID])}
- B. {FIXED [Customer ID], [Region]: COUNTD([Order ID])}
- C. {FIXED [Customer ID], [Region], [Order Date]: COUNTD([Order ID])}
- D. {INCLUDE [Customer ID]: COUNTD([Order ID])}
Answer: B
Explanation:
The calculation {FIXED [Customer ID], [Region]: COUNTD([Order ID])} is the correct one to use for this scenario. This Level of Detail (LOD) expression will calculate the distinct count of orders for each customer within each region, which is then averaged per month. This approach ensures that the average number of orders per customer is accurately calculated for each region and then broken down by month, aligning with the client's expectations.
References: The LOD expressions in Tableau allow for precise control over the level of detail at which calculations are performed, which is essential for accurate data analysis. The use of {FIXED} expressions to specify the granularity of the calculation is a common practice and is well-documented in Tableau's official resources12.
The initial calculation provided by the client likely overestimates the average number of orders per customer per month by region due to improper granularity control. The revised calculation must take into account both the customer and the region to correctly aggregate the data:
FIXED Level of Detail Expression: This calculation uses a FIXED expression to count distinct order IDs for each customer within each region. This ensures that the count of orders is correctly grouped by both customer ID and region, addressing potential duplication or misaggregation issues.
Accurate Aggregation: By specifying both [Customer ID] and [Region] in the FIXED expression, the calculation prevents the overcounting of orders that may appear if only customer ID was considered, especially when a customer could be ordering from multiple regions.
References:
Level of Detail Expressions in Tableau: These expressions allow you to specify the level of granularity you need for your calculations, independent of the visualization's level of detail, thus offering precise control over data aggregation.
NEW QUESTION # 31
A client wants to flag orders that have sales higher than the regional average.
Which calculated field will produce the required result?
- A. { FIXED [Order ID] : SUM([Sales]) }
>
{ FIXED [Region] : AVG({ FIXED [Order ID] : SUM([Sales]) }) } - B. { FIXED [Order ID] : SUM([Sales]) }
>
{ FIXED [Region] : SUM([Sales]) } - C. [Sales]
>
{ FIXED [Order ID] : SUM([Sales]) } - D. { FIXED [Order ID] : SUM([Sales]) }
>
{ INCLUDE [Region] : AVG({ FIXED [Order ID] : SUM([Sales]) }) }
Answer: A
Explanation:
To flag orders with sales higher than the regional average, the correct calculated field would compare the sum of sales for each order against the average sales of all orders within the same region:
Correct Formula: { FIXED [Order ID] : SUM([Sales]) } > { FIXED [Region] : AVG({ FIXED [Order ID] : SUM([Sales]) }) } This calculation uses a Level of Detail (LOD) expression:
The left part of the formula { FIXED [Order ID] : SUM([Sales]) } calculates the total sales for each individual order.
The right part { FIXED [Region] : AVG({ FIXED [Order ID] : SUM([Sales]) }) } calculates the average sales per order within each region.
The > operator is used to compare these two values to determine if the sales for each order exceed the regional average.
References
This formula utilizes Tableau's LOD expressions to perform complex comparisons across different dimensions of the data, as explained in Tableau's official training materials on LOD calculations.
NEW QUESTION # 32
A client has a pipeline dashboard that takes a long time to load. The dashboard is connected to only one large data source that is an extract.
It contains two calculated fields:
. TOTAL([Opportunities])
* SUM([Value])
It also contains two filters:
. A Relative Date filter on Created Date, a Date field containing values from 5 years ago until today
. A Multiple Values (Dropdown) filter on Account Name, a String field containing 1,000 distinct values A consultant creates a Performance Recording to troubleshoot the issue, and finds out that the longest-running event is "Executing Query." Which step should the consultant take to resolve this issue?
- A. Replace SUM([Value]) with WINDOW_SUM([Value]).
- B. Replace the TOTAL([Opportunities]) calculation with a Grand Total.
- C. Replace the Multiple Values (Dropdown) filter with a Multiple Values (Custom List) filter.
- D. Replace the Relative Date filter with a Multiple Values (Dropdown) filter on YEAR([Created Date]).
Answer: D
Explanation:
To improve the loading time of the pipeline dashboard, which primarily suffers from long query execution times due to a comprehensive Relative Date filter:
Relative Date Filter Issue: The existing Relative Date filter on "Created Date" covers a broad range (5 years), leading to significant data processing overhead as it includes granular date calculations over a large dataset.
Optimized Approach: By replacing the Relative Date filter with a Multiple Values (Dropdown) filter based on YEAR([Created Date]), the filter granularity is reduced. Filtering by year simplifies the query by limiting the volume of data processed and reducing the complexity of the filter condition.
Implementation Benefit: This approach still provides the flexibility to view data across different years but does so by reducing the load on the database during query execution, which is critical for improving the performance of the dashboard.
References
This recommendation aligns with Tableau performance optimization strategies, specifically regarding the management of date filters to minimize their impact on query load, as discussed in Tableau performance tuning sessions and guides.
NEW QUESTION # 33
For a new report, a consultant needs to build a data model with three different tables, including two that contain hierarchies of locations and products. The third table contains detailed warehousing data from all locations across six countries. The consultant uses Tableau Cloud and the size of the third table excludes using an extract.
What is the most performant approach to model the data for a live connection?
- A. Joining the tables in Tableau Prep
- B. Joining the tables in Tableau Desktop
- C. Relating the tables in Tableau Desktop
- D. Blending the first two tables with the third
Answer: C
Explanation:
For a performant live connection in Tableau Cloud, especially when dealing with large datasets that preclude the use of extracts, relating the tables in Tableau Desktop is the recommended approach. This method allows for flexibility in how the data is queried and can improve performance by leveraging Tableau's relationships feature, which optimizes queries for the underlying database.
References: The best practices for live connections in Tableau Cloud suggest using relationships to manage complex data models efficiently1. Additionally, Tableau's documentation on connecting data sources recommends using relationships for better performance with live connections2.
NEW QUESTION # 34
A client wants to provide sales users with the ability to perform the following tasks:
* Access published visualizations and published data sources outside the company network.
* Edit existing visualizations.
* Create new visualizations based on published data sources.
. Minimize licensing costs.
Which site role should the client assign to the sales users?
- A. Site Administrator
- B. Creator
- C. Explorer (can publish)
- D. Viewer
Answer: C
Explanation:
The Explorer (can publish) site role in Tableau is designed for users who need to access, edit, and create visualizations based on published data sources, even when they are outside the company network. This role allows users to perform web editing and save their work, making it suitable for sales users who need these capabilities. It is also a cost-effective option as it does not require the full capabilities and associated costs of the Creator license.
References: The information about the Explorer (can publish) role and its capabilities can be found in the official Tableau documentation on site roles and permissions12. This role is appropriate for users who need to interact with published content and create new visualizations without the need for full site administration or advanced content creation tools that come with the Creator role3.
NEW QUESTION # 35
For a new report, a consultant needs to build a data model with three different tables, including two that contain hierarchies of locations and products. The third table contains detailed warehousing data from all locations across six countries. The consultant uses Tableau Cloud and the size of the third table excludes using an extract.
What is the most performant approach to model the data for a live connection?
- A. Joining the tables in Tableau Prep
- B. Joining the tables in Tableau Desktop
- C. Relating the tables in Tableau Desktop
- D. Blending the first two tables with the third
Answer: C
Explanation:
For a performant live connection in Tableau Cloud, especially when dealing with large datasets that preclude the use of extracts, relating the tables in Tableau Desktop is the recommended approach. This method allows for flexibility in how the data is queried and can improve performance by leveraging Tableau's relationships feature, which optimizes queries for the underlying database.
References: The best practices for live connections in Tableau Cloud suggest using relationships to manage complex data models efficiently1. Additionally, Tableau's documentation on connecting data sources recommends using relationships for better performance with live connections2.
NEW QUESTION # 36
SIMULATION
Refer to the exhibit.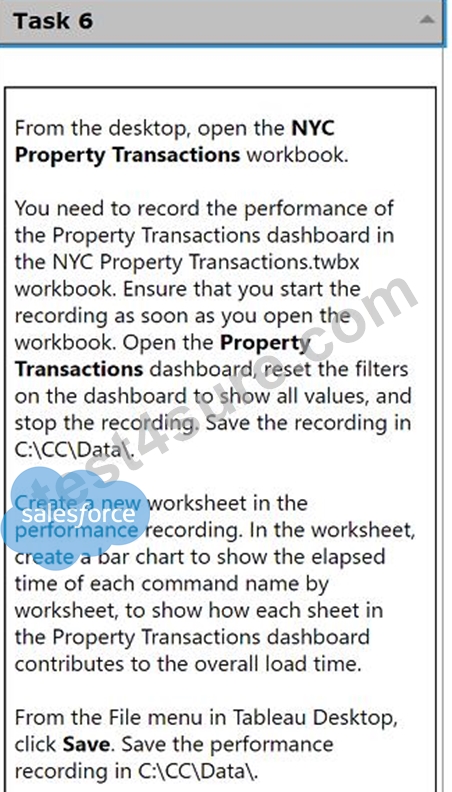
From the desktop, open the NYC
Property Transactions workbook.
You need to record the performance of
the Property Transactions dashboard in
the NYC Property Transactions.twbx
workbook. Ensure that you start the
recording as soon as you open the
workbook. Open the Property
Transactions dashboard, reset the filters
on the dashboard to show all values, and
stop the recording. Save the recording in
C:\CC\Data\.
Create a new worksheet in the
performance recording. In the worksheet,
create a bar chart to show the elapsed
time of each command name by
worksheet, to show how each sheet in
the Property Transactions dashboard
contributes to the overall load time.
From the File menu in Tableau Desktop,
click Save. Save the performance
recording in C:\CC\Data\.
Answer:
Explanation:
See the complete Steps below in Explanation
Explanation:
To record the performance of the Property Transactions dashboard in the NYC Property Transactions.twbx workbook and analyze it using a bar chart, follow these detailed steps:
Open the NYC Property Transactions Workbook:
From the desktop, double-click the NYC Property Transactions.twbx workbook to open it in Tableau Desktop.
Start Performance Recording:
Before doing anything else, navigate to the 'Help' menu in Tableau Desktop.
Select 'Settings and Performance', then choose 'Start Performance Recording'.
Open the Property Transactions Dashboard and Reset Filters:
Navigate to the Property Transactions dashboard within the workbook.
Reset all filters to show all values. This usually involves selecting the dropdown on each filter and choosing 'All' or using a 'Reset' button if available.
Stop the Performance Recording:
Go back to the 'Help' menu.
Choose 'Settings and Performance', then select 'Stop Performance Recording'.
Tableau will automatically open a new tab displaying the performance recording results.
Save the Performance Recording:
In the performance recording results tab, go to the 'File' menu.
Click 'Save As' and navigate to the C:\CC\Data\ directory.
Save the file, ensuring it is stored in the desired location.
Create a New Worksheet for Performance Analysis:
Return to the NYC Property Transactions workbook and create a new worksheet by clicking on the 'New Worksheet' icon.
Drag the 'Command Name' field to the Columns shelf.
Drag the 'Elapsed Time' field to the Rows shelf.
Ensure that the 'Worksheet' field is also included in the analysis to break down the time by individual sheets within the dashboard.
Choose 'Bar Chart' from the 'Show Me' options to display the data as a bar chart.
Customize and Finalize the Bar Chart:
Adjust the axes and labels to clearly display the information.
Format the chart to enhance readability, applying color coding or sorting as needed to emphasize sheets with longer load times.
Save Your Work:
Once the new worksheet and the performance recording are complete, ensure all work is saved.
Navigate to the 'File' menu and click 'Save', confirming that changes are stored in the workbook.
References:
Tableau Help Documentation: Provides guidance on how to start and stop performance recordings and analyze them.
Tableau Visualization Techniques: Offers tips on creating effective bar charts for performance data.
By following these steps, you have successfully recorded and analyzed the performance of the Property Transactions dashboard, providing valuable insights into how each component of the dashboard contributes to the overall load time. This analysis is crucial for optimizing dashboard performance and ensuring efficient data visualization.
NEW QUESTION # 37
A client collects information about a web browser customers use to access their website. They then visualize the breakdown of web traffic by browser version.
The data is stored in the format shown below in the related table, with a NULL BrowserID stored in the Site Visitor Table if an unknown browser version accesses their website.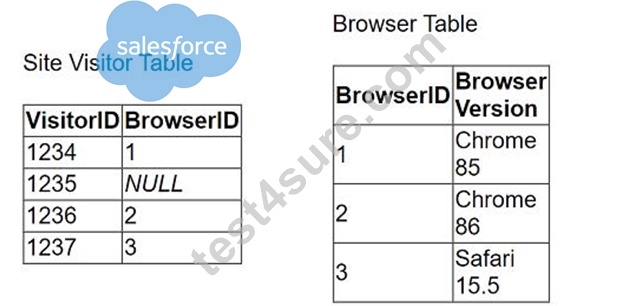
The client uses "Some Records Match" for the Referential Integrity setting because a match is not guaranteed. The client wants to improve the performance of the dashboard while also getting an accurate count of site visitors.
Which modifications to the data tables and join should the consultant recommend?
- A. Continue to use NULL as the BrowserID in the Site Visitor Table and leave the Referential Integrity set to "Some Records Match."
- B. Add an "Unknown" option to the Browser Table, reference its BrowserID in the Site Visitor Table, and leave the Referential Integrity set to
"Some Records Match." - C. Continue to use NULL as the BrowserID in the Site Visitor Table and change the Referential Integrity to "All Records Match."
- D. Add an "Unknown" option to the Browser Table, reference its BrowserID in the Site Visitor Table, and change the Referential Integrity to "All Records Match."
Answer: D
Explanation:
To improve the performance of a Tableau dashboard while maintaining accurate counts, particularly when dealing with unknown or NULL BrowserIDs in the data tables, the following steps are recommended:
Modify the Browser Table: Add a new row to the Browser Table labeled "Unknown," assigning it a unique BrowserID, e.g., 0 or 4.
Update the Site Visitor Table: Replace all NULL BrowserID entries with the BrowserID assigned to the "Unknown" entry. This ensures every record in the Site Visitor Table has a valid BrowserID that corresponds to an entry in the Browser Table.
Change Referential Integrity Setting: Change the Referential Integrity setting from "Some Records Match" to "All Records Match." This change assumes all records in the primary table have corresponding records in the secondary table, which improves query performance by allowing Tableau to make optimizations based on this assumption.
References:
Handling NULL Values: Replacing NULL values with a valid unknown option ensures that all data is included in the analysis, and integrity between tables is maintained, thereby optimizing the performance and accuracy of the dashboard.
NEW QUESTION # 38
A client is searching for ways to curate and document data in order to obtain data lineage. The client has a data source connected to a data lake.
Which tool should the consultant recommend to meet the client's requirements?
- A. Tableau Catalog with Tableau Server Management Add-on
- B. Tableau Catalog with Tableau Data Management Add-on
- C. Tableau Prep Conductor
- D. Tableau Catalog without Tableau Data Management Add-on
Answer: B
Explanation:
To effectively curate and document data for obtaining data lineage, particularly from a data source connected to a data lake, the recommended tool is:
Tableau Catalog with Tableau Data Management Add-on: This add-on enhances the capabilities of Tableau Catalog, providing extensive features for data management, including detailed data lineage, impact analysis, and metadata management.
Functionality: The Tableau Catalog with the Data Management Add-on allows users to see the full history and lineage of the data, trace its usage across all Tableau content, and understand dependencies. It also facilitates better governance and transparency in data handling.
Why Choose this Tool: For a client needing comprehensive data lineage and documentation capabilities, this add-on ensures that data stewards and users can maintain and utilize a well-managed data environment. It supports robust data governance practices necessary for large and complex data ecosystems like those typically associated with data lakes.
References
The recommendation is based on the functionalities offered by the Tableau Data Management Add-on, as described in Tableau's official documentation on managing and documenting data sources for enhanced governance and operational efficiency.
NEW QUESTION # 39
A client builds a dashboard that presents current and long-term stock measures. Currently, the data is at a daily level. The data presents as a bar chart that presents monthly results over current and previous years. Some measures must present as monthly averages.
What should the consultant recommend to limit the data source for optimal performance?
- A. Limit data to current and previous years, move calculating averages to data layer, and aggregate dates to monthly level.
- B. Limit data to current and previous years and leave data at daily level to calculate the averages in the report.
- C. Move calculating averages to data layer and aggregate dates to monthly level.
- D. Limit data to current and previous years as well as to the last day of each month to eliminate the need to use the averages.
Answer: A
Explanation:
For optimal performance, it is recommended to limit the data to what is necessary for analysis, which in this case would be the current and previous years. Moving the calculation of averages to the data layer and aggregating the dates to a monthly level will reduce the granularity of the data, thereby improving the performance of the dashboard. This approach aligns with best practices for optimizing workbook performance in Tableau, which suggest simplifying the data model and reducing the number of records processed12.
References: The recommendation is based on the guidelines provided in Tableau's official documentation on optimizing workbook performance, which includes tips on data management and aggregation for better performance12.
NEW QUESTION # 40
A client's dashboard has two sections dedicated to their shops and warehouses shown when a viewer chooses either shops or warehouses with a parameter.
There are a few quick filters that apply to both, while others apply to only shops or only warehouses.
Currently, the quick filters are all shown at the left side of the dashboard. The client wants to hide all filters, but when shown, make it easy for the viewer to find the quick filters that work for only shops or only warehouses.
Which solution should the consultant recommend that meets the client's needs and is most user-friendly?
- A. Use Dynamic Zone Visibility to show only the quick filters that apply with the chosen parameter value and a Show/Hide Button to hide container with all the filters.
- B. Hide container with all quick filters with a Show/Hide Button.
- C. Use Dynamic Zone Visibility to inform viewers which quick filters apply to warehouses or shops.
- D. Divide the quick filters into three groups: General, for shops. Place the general filters on the left of dashboard for warehouses. Place other filters next to the sections to which they apply.
Answer: A
Explanation:
The most user-friendly solution is to use Dynamic Zone Visibility in combination with a Show/Hide Button. This approach allows the dashboard to dynamically display only the relevant quick filters based on the viewer's selection of shops or warehouses, thus reducing clutter and focusing the user's attention on applicable filters. The Show/Hide Button further enhances the user experience by allowing viewers to toggle the visibility of the filter container, providing a clean and organized dashboard interface1.
References: Dynamic Zone Visibility is a feature in Tableau that enables dashboard elements to appear or disappear based on the value of a field or parameter1. This functionality is ideal for creating interactive and user-friendly dashboards that adapt to user interactions and selections1.
NEW QUESTION # 41
A client wants to migrate their Tableau Server to Tableau Cloud. The Tableau Server is configured with three sites: Finance, Strategy, and Marketing. A consultant must provide a solution that minimizes user impact and costs.
Which configuration should the consultant recommend for Tableau Cloud to meet the client's requirements?
- A. One Tableau Cloud instance configured with a Finance project folder, Strategy project folder, and Marketing project folder
- B. Three separate Tableau Cloud instances for Finance, Strategy, and Marketing
- C. One Tableau Cloud instance with two sites for Strategy and Marketing, and one Tableau Server instance for Finance
- D. One Tableau Cloud instance configured with all workbooks in a single project
Answer: A
Explanation:
To minimize user impact and costs while migrating from Tableau Server to Tableau Cloud with multiple sites, the best solution is:
Single Tableau Cloud Instance with Multiple Projects: Instead of multiple sites which could imply higher management overhead and possibly higher costs, configuring one Tableau Cloud instance with different project folders for each former site (Finance, Strategy, Marketing) is most efficient.
Benefits: This setup maintains organizational separation of data and access similar to having different sites but leverages the unified management and simplicity of a single cloud instance. It reduces complexity in user access management and integration points.
Implementation: Each project folder acts like a mini-site within the larger instance, where specific permissions and content can be managed independently, akin to the original server setup but within a single cloud-based environment.
References
This recommendation is in line with best practices for cloud migration focusing on consolidation and cost efficiency, as suggested in Tableau's official documentation for cloud migration strategies.
NEW QUESTION # 42
A client wants guidance for Creators to build efficient extracts from large data sources.
What are three Tableau best practices that the Creators should use? Choose three.
- A. Include all the data from the original data source in the extract.
- B. Use aggregate data for visible dimensions, whenever possible.
- C. Hide all unused fields.
- D. Use only live connections as they are always faster than extracts.
- E. Keep only the data required for analysis by using extract filters.
Answer: B,C,E
Explanation:
To build efficient extracts from large data sources, it is crucial to minimize the load and optimize the performance of the extracts:
A . Keep only the data required for analysis by using extract filters: This best practice involves using filters to reduce the volume of data extracted, thus focusing only on the data necessary for analysis.
B . Use aggregate data for visible dimensions, whenever possible: Aggregating data at the time of extraction reduces the granularity of the data, which can significantly improve performance and reduce the size of the extract.
E . Hide all unused fields: Removing fields that are not needed for analysis from the extract reduces the complexity and size of the data model, which in turn enhances performance and speeds up load times.
These practices are endorsed in Tableau's official documentation and training sessions as effective ways to enhance the performance of Tableau extracts and optimize dashboard responsiveness.
NEW QUESTION # 43
A consultant migrated a data source to improve performance. The consultant wants to identify which workbooks need to be updated to point to the new data source.
Which Tableau tool should the consultant use?
- A. Tableau Advanced Management
- B. Data Management
- C. Prep Conductor
- D. Activity Log
Answer: A
Explanation:
To identify which workbooks need to be updated to point to a new data source after a migration, a consultant should use Tableau Advanced Management. This component of Tableau provides comprehensive management capabilities including the ability to track workbook dependencies and data source usage across your entire Tableau environment. Using Tableau Advanced Management allows consultants to assess the impact of changes in the data source on connected workbooks and efficiently manage updates.
NEW QUESTION # 44
A client has a large data set that contains more than 10 million rows.
A consultant wants to calculate a profitability threshold as efficiently as possible. The calculation must classify the profits by using the following specifications:
. Classify profit margins above 50% as Highly Profitable.
. Classify profit margins between 0% and 50% as Profitable.
. Classify profit margins below 0% as Unprofitable.
Which calculation meets these requirements?
- A. IF [ProfitMargin]>0.50 Then 'Highly Profitable'
ELSEIF [ProfitMargin]>=0 Then 'Profitable'
ELSE 'Unprofitable'
END - B. IF([ProfitMargin]>=0.50,'Highly Profitable', 'Profitable')
ELSE 'Unprofitable'
END - C. IF [ProfitMargin]>0.50 Then 'Highly Profitable'
ELSEIF [ProfitMargin]>=0 Then 'Profitable'
ELSEIF [ProfitMargin] <0 Then 'Unprofitable'
END - D. IF [ProfitMargin]>=0.50 Then 'Highly Profitable'
ELSEIF [ProfitMargin]>=0 Then 'Profitable'
ELSE 'Unprofitable'
END
Answer: D
Explanation:
The correct calculation for classifying profit margins into categories based on specified thresholds involves the use of conditional statements that check ranges in a logical order:
Highly Profitable Classification: The first condition checks if the profit margin is 50% or more. This must use the ">=" operator to include exactly 50% as "Highly Profitable".
Profitable Classification: The next condition checks if the profit margin is between 0% and 50%. Since any value falling at or above 50% is already classified, this condition only needs to check for values greater than or equal to 0%.
Unprofitable Classification: The final condition captures any remaining scenarios, which would only be values less than 0%.
References:
Logical Order in Conditional Statements: It is crucial in programming and data calculation to ensure that conditions in IF statements are structured in a logical and non-overlapping manner to accurately categorize all possible values.
NEW QUESTION # 45
A client has a database that stores widget inventory by day and it is updated on a nonstandard schedule as shown below.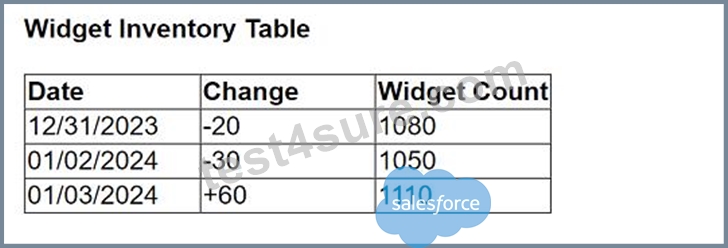
They want a data visualization that shows widget inventory daily, however their business unit does not have the ability to modify the data warehouse structure.
What should the client do to achieve the desired result?
- A. Update the Widget Inventory Table to be a daily snapshot.
- B. Use Tableau Prep to add new rows.
- C. Use Tableau Desktop to visualize null values.
- D. Create a temporary table in the database.
Answer: B
Explanation:
For a client who needs a daily visualization of widget inventory but cannot modify the data warehouse structure, the best approach is to use Tableau Prep to add new rows. Tableau Prep can be used to manipulate the existing dataset by adding missing date entries and appropriately adjusting inventory counts based on available data. This allows the creation of a complete daily snapshot for visualization without needing changes to the underlying database structure.
NEW QUESTION # 46
A consultant creates a histogram that presents the distribution of profits across a client's customers. The labels on the bars show percent shares. The consultant used a quick table calculation to create the labels.
Now, the client wants to limit the view to the bins that have at least a 15% share. The consultant creates a profit filter but it changes the percent labels.
Which approach should the consultant use to produce the desired result?
- A. Filter with a table calculation WINDOW_AVG(MIN([Profit]), first(), last())
- B. Filter with the table calculation used to create labels.
- C. Add the [Profit] filter to the context.
- D. Use a calculation with TOTAL() function instead of a quick table calculation.
Answer: C
Explanation:
When a filter is applied directly to the view, it can affect the calculation of percentages in a histogram because it changes the underlying data that the quick table calculation is based on. To avoid this, adding the [Profit] filter to the context will maintain the original calculation of percent shares while filtering out bins with less than a 15% share. This is because context filters are applied before any other calculations, so the percent shares calculated will be based on the context-filtered data, thus preserving the integrity of the original percent labels.
References: The solution is based on the principles of context filters and their order of operations in Tableau, which are documented in Tableau's official resources and community discussions123.
When a histogram is created showing the distribution of profits with labels indicating percent shares using a quick table calculation, and a need arises to limit the view to bins with at least a 15% share, applying a standard profit filter directly may undesirably alter how the percent labels calculate because they depend on the overall distribution of data. Placing the [Profit] filter into the context makes it a "context filter," which effectively changes how data is filtered in calculations:
Create a Context Filter: Right-click on the profit filter and select "Add to Context". This action changes the order of operations in filtering, meaning the context filter is applied first.
Adjust the Percent Calculation: With the profit filter set in the context, it first reduces the data set to only those profits that meet the filter criteria. Subsequently, any table calculations (like the percent share labels) are computed based on this reduced data set.
View Update: The view now updates to display only those bins where the profits are at least 15%, and the percent share labels recalculated to reflect the distribution of only the filtered (contextual) data.
References:
Context Filters in Tableau: Context filters are used to filter the data passed down to other filters, calculations, the marks card, and the view. By setting the profit filter as a context filter, it ensures that calculations such as the percentage shares are based only on the filtered subset of the data.
NEW QUESTION # 47
A client calculates the percent of total sales for a particular region compared to all regions.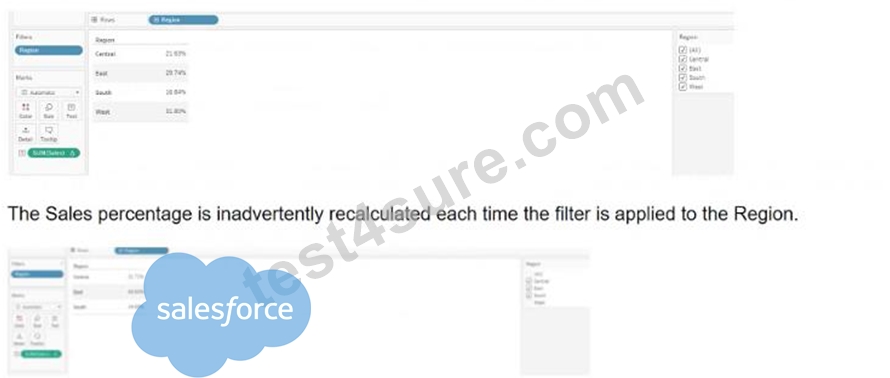
Which calculation will fix the automatic recalculation on the % of total field?
- A. {FIXED [Region]:[Sales]}/{FIXED: SUM([Sales])}
- B. {FIXED [Region]:sum([Sales])}/{FIXED :SUM([Sales])
- C. {FIXED [Region]:sum([Sales])}
- D. {FIXED [Region]:sum([Sales])}/SUM([Sales]}
Answer: D
Explanation:
To correctly calculate the percent of total sales for a particular region compared to all regions, and to ensure that the calculation does not get inadvertently recalculated with each region filter application, the recommended calculation is:
{FIXED [Region]: sum([Sales])}: This part of the formula computes the sum of sales for each region, regardless of any filters applied to the view. It uses a Level of Detail expression to fix the sum of sales to each region, ensuring that filtering by regions won't affect the calculated value.
SUM([Sales]): This part computes the total sum of sales across all regions and is recalculated dynamically based on the filters applied to other parts of the dashboard or worksheet.
Combining the two parts: By dividing the fixed regional sales by the total sales, we get the proportion of sales for each region as compared to the total. This calculation ensures that while the denominator adjusts according to filters, the numerator remains fixed for each region, accurately reflecting the sales percentage without being affected by the region filter directly.
References
This calculation follows Tableau's best practices for using Level of Detail expressions to manage computation granularity in the presence of dashboard filters, as outlined in the Tableau User Guide and official Tableau training materials.
NEW QUESTION # 48
......
Latest Analytics-Con-301 Actual Free Exam Questions Updated 57 Questions: https://freecert.test4sure.com/Analytics-Con-301-exam-materials.html